Since eating patterns around the world vary substantially, the impact of changing dietary behaviours, meal composition, or ingredients is also likely to vary between countries, regions, and continents. The per-capita consumption of meat might be quite similar in two different regions, but one region might consume more pork while the other consumes more poultry – thus a meat-reduction intervention might spare more animals in the latter country. Furthermore, there are other differences that have an impact on eating patterns: for example, the yield per animal (meat, milk, eggs) might be quite different in different regions, again affecting the number of animals needed to produce a certain quantity of meat, milk, or eggs. Last but not least, the consumption of animal products per person might be low in some regions, while total production might be quite high due to a large population (or export industry).
In order to take all of the above into account, we use data on production and consumption provided by the Food and Agriculture Organization of the United Nations (FAO) since they provide a comprehensive overview of all countries, regions, and continents. Note that we have chosen 2016 as the baseline year for our calculations.
We used the following data for our calculations:
- ‘Livestock Primary’: this data set contains data on production in tons as well as the number of producing or slaughtered land animals per region per year.1
- ‘Food Balance Sheets’: this data set contains information on production, imports, exports, and other utilisations, as well as the food supply per person per year for specific products.2
- ‘Detailed Trade Matrix’: this data set contains data on the trade of different products between different countries.3
- Data on edible yields.4
- Data on meat cuts.5 6 7
We used R-Statistics to process the data and to generate the final database for the calculator. As the data in the calculator is not hardcoded, it will be possible to adapt the calculations in the future and to include other factors that might have an influence on the amount of animals in order to get more detailed results or to update the calculator with new data as time progresses so that it represents the current status of dietary behaviours around the globe.
Calculation steps
- Calculate the yield-per-animal from domestic production
- Correct yield-per-animal for imports with the help of trade data
- Calculate the edible yield-per-animal
Calculations for Ingredients
- Calculate the number of animals used by replacing ingredients
Calculations for meals
- Calculate the number of animals used for each species to produce 100 grams of meat
- Calculate the average number of animals per meal
Calculations for diets
- Calculate the number of animals used for total food supply
- Calculate the number of animals per person per year
1. Calculate the yield per animal from domestic production
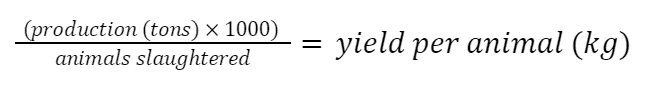
To calculate the yield per animal, we simply divide the amount of meat produced in a certain region by the number of animals slaughtered. Note that production refers to the dressed carcass weight, excluding offal and slaughter fats but including bones.
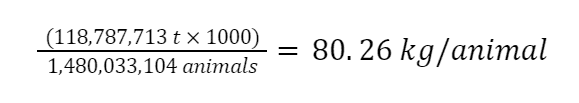
Example: pig meat, globally
- Production: 118.8 million tonnes
- Animals slaughtered: 1.48 billion Animals
2. Correct yield-per-animal with the help of trade data (only on continental, sub-region, or country level, not on a global level)
Not all animals utilised in a certain world region are produced in this region. Imports and exports can also play a large role. As explained above, yields of animals from different regions can differ significantly, thus also having an influence on the yield per animal for domestic supply. To account for this, we used the FAO’s Detailed Trade Matrix to determine where imports are coming from.
The average yield-per-animal from imported meat has been calculated as a weighted average of the yield-per-animal from the importer countries weighted against the import quantity.
Table 1: Example US pig meat imports
| Reporter Country | Partner country | Import proportion | Yield per animal from step 1 (kg) |
| United States of America | Canada | 98.1% | 97 |
| United States of America | Poland | 1.4% | 91 |
| United States of America | Chile | 0.47% | 101 |
| Weighted average | 97 |
In the next step, we look at the proportion of the amount of domestic supply that was produced within a country and that which was imported.

With the example of pig meat in the US, the yield-per-animal would be at about 95.77 kg l (instead of 95.69 if there were no imports) – The difference here is small, but can be much higher in countries where the import quantity is much higher, or where there is very little or no domestic production.
3. Calculate the edible yield per animal
Since data on production is expressed in terms of dressed carcass weight, it includes bones and other parts that are not generally consumed by humans. In order to correct for this, we use a couple of factors to calculate the edible meat yield:8
- 70% for meat from cattle
- 75% for pig, sheep, and goat meat
- 80% for meat from poultry
In the case of pig meat, this would be:
80.26 kg per animal x 0.75 = 60.2 kg per animal
CALCULATIONS FOR INGREDIENTS
4. Calculate the number of animals by replacing ingredients
In the next step, we calculate the number of animals whose slaughter or use is avoided by replacing ingredients. This is done by dividing the number that is inputted (quantity of ingredients, in kgs) by the edible meat yield which can optionally be multiplied by the factor used for the different meat cuts.
For example, for pig meat without choosing a specific cut:
100 kg / 60.2 kg per animal = 1.66 animals needed for 100 kg of pig meat
This is done for all the animal species for which we provide calculations.
An optional choice in the calculator is to choose more specific cuts of meat, such as wings or breast for poultry or ham for pigs. Furthermore, it is possible to go into more detail when it comes to eggs, by choosing egg yolks and egg whites.
To account for this, we used factors from the following sources.
- Bovine meat: Penn State Extension (2016): Understanding Beef Carcass Yields and Losses During Processing. Available at: https://extension.psu.edu/understanding-beef-carcass-yields-and-losses-during-processing [22.11.2021]
- Poultry meat: Park, SY, DS Byeon, GW Kim, et al. (2021): Carcass and retail meat cuts quality properties of broiler chicken meat based on the slaughter age. Journal of animal science and technology vol. 63,1 (2021): 180-190. doi:10.5187/jast.2021.e2
- Pig meat: University of Wisconsin-Madison (n.d.): How much meat should a hog yield? Available at: https://livestock.extension.wisc.edu/articles/how-much-meat-should-a-hog-yield/ [22.11.2021]
Following the calculation in step 3, the calculation on meat cuts would work as follows:
(Edible meat yield per animal / meat-cut factor) = weight of cut per animal
Example for pig meat, when choosing ham as meat cut
100 kg / (60.2 x 0.25 ) = 6.64 animals needed for 100 kg of ham
It is important to note that other parts of the animals are also utilised, so it might lead to double-counting when doing those calculations for different meat cuts of the same animal species. When combining different cuts from the same animal type, you should assume that each cut will be calculated as coming from a new animal.
CALCULATIONS FOR MEALS
5. Calculate the number of animals in 100 g of meat, per species
When calculating the number of animals spared by replacing meat-centred meals with plant-based ones, we assume that every meal we replace was not plant-based beforehand. We further assume that every meal replaced with a more plant-friendly option contained about 100 g of meat.
Thus, we calculate the number of animals in 100 g of meat (and since we assume 100 g of meat per meal, the number of animals per meal). This is done by dividing 100 g by the edible meat yield.
Example, for pig meat:
0.1kg / 60.2 kg per animal = 0.00166 animals in 100 g of meat
This is done for all the animal species for which we provide calculations. These numbers can be used to calculate the number of animals spared when replacing meals that contain specific kinds of meat, e.g. poultry meat or meat from cows.
6. Calculate the average number of animals per meal
Because we generally don’t know exactly what kinds of meals we influence, we thus need to generalise. Since each country has its own specific dietary patterns, the composition of an ‘average’ meal can vary quite widely and contain different animals. After we calculate the number of animals in 100 g of meat, per species, we calculate a weighted average, weighing it against the per-capita food supply of those items in each region.
Table 2: Food supply, with different kinds of meat and numbers of animals in 100 g of meat (global average)
| Item | Food supply (kg/capita/year) | Animals per 100 g/animals per meal |
| Meat from cattle | 8.88 | 0.00066 |
| Meat from sheep and goats | 1.97 | 0.0092 |
| Pig meat | 15.37 | 0.00166 |
| Poultry meat | 15.31 | 0.0730 |
| Other meat* | 0.75 | 0.044 |
| Weighted average | 0.0284 |
For example, calculation with 1000 meals (global average):
1000 * 0.0284 = 28,4 animals
Sometimes it might be known which kinds of meals have been replaced and thus it is possible to choose meat from different animals to provide a more detailed result.
For example, calculation with 1000 meals based on poultry meat (global average):
1000 * 0.073 = 73 animals.
As in the ingredients calculator, an optional choice here is to choose more specific cuts of meat for an even more specific result.
Following the calculation in step 4, the calculation on meat cuts would work as follows:
Amount of animals in 100 g of meat / meat-cut factor = Amount of animals needed for weight of cut per animal
For example, calculation with 1000 meals based on wings of poultry (global average):
1000 * 0.073/xy = xy animals.
CALCULATIONS FOR DIETS
7. Calculate the number of animals used for total food supply.
To calculate the number of animals used for total food supply, we use production and animal numbers from FAO production statistics as well as data on total food supply from the Food Balance Sheets. Data on production, in tons, and the number of animals eaten are directly linked. Not everything that is produced in a specific country is also eaten there. The total food supply is what is left for consumption in a specific country after imports, exports, and other factors such as losses are taken into account. Using triangulation, we calculate the number of animals slaughtered for food supply in a given country, region or continent.
Table 3: Example of the amount/number of animals for food in Germany
| Item | Production (t) | Animals from production | Food supply (t) | Animals used for food |
| Bovine meat | 1,155,483 | 3,640,070 | 1,200,000 | 3,780,310 |
| Poultry meat | 1,526,652 | 689,442,000 | 1,474,000 | 665,664,151 |
| Pig meat | 5,589,639 | 59,480,468 | 3,784,000 | 40,266,302 |
8. Calculate the number of animals consumed per person per year
The amount of animals from each species for food, taken from the first step of the calculation, is divided by the population calculated in step 2.
Table 4: Example of the number of animals consumed per person in Germany
| Item | Animals for food | Population (millions) | Animals per capita |
| Bovine meat | 3,780,310 | 82.2 | 0.046 |
| Poultry meat | 665,664,151 | 82.2 | 8.098 |
| Pig meat | 40,266,302 | 82.2 | 0.489 |
| Mutton & goat meat | 2,304,337 | 82.2 | 0.028 |
| Other meat | 118,214,083 | 82.2 | 1.438 |
| Eggs | 52,922,713 | 82.2 | 1.282* |
| Milk | 1,763,460 | 82.2 | 0.042 |
| TOTAL | 88,4915,356 | 82.2 | 11.4 |
Please note, the results section currently shows all animals, while the detailed breakdown at the bottom currently does not include “Mutton & goat meat” and the category “other meat”.
Limitations
This is a not comprehensive list of limitations.
Limitations of the FAO data
Data from the different databases provided by the FAO can, from time to time, contain slightly different data on the same area of analysis. This can vary to such a degree that the production values from the production data do not always fit the production data from the Food Balance Sheets, and that import and export data from the Detailed Trade Matrix do not always directly match the trade data from the Food Balance Sheets. Furthermore, data from the FAO might sometimes differ from official country statistics.
Data that is not included
The calculations on meals currently reflect only meat consumption. Dairy products and eggs have not yet been considered. Furthermore, the model currently excludes fish and invertebrates. If these animals were included, the number of animals spared could increase tremendously. Furthermore, the data currently being used only reflects animals used directly for human consumption – it does not include, for example, animals that have died before slaughter or the number of male chicks that have been culled during egg production.
Edible meat yield
For now, only one figure per animal is used and applied globally. Of course, this might not be completely accurate in every case. As with consumption and yields, the utilisation of the carcass and leftovers is also likely to vary between regions. For our calculations and the sake of simplicity, we currently assume the same value for every region. This might be adjusted in the future.
Meat cuts and what is mostly eaten from the animal
The number of animals consumed per meal could be further influenced by other factors, such as the use of different meat cuts, which would further increase the amount of animals needed for specific purposes. We are aware that terminology on meat cuts vary greatly among regions and countries. However, for the sake of simplicity, we have chosen the US system, as this was also the system where specific percentages from the carcass weight were provided. We applied those numbers to all regions and countries, even though cuts and utilisation of animals might differ. In the future, it might be possible to add further systems for other countries and regions if we are able to determine accurate figures.
Eggs and Milk
The amount of animals spared for eggs and milk might actually be even higher depending on the exact ingredient used. For example dehydrated egg white or milk powder use more eggs/ milk per kg of product than the original, not further processed ingredients. Thus the amount of animals might be even higher in those cases.
For the diet calculator, we assume that for every laying hen a male chicken is culled, as the sex ratio is assumed to be roughly 1:1. However, in some countries and regions, the culling of male chicks from egg production has now been banned or there is discussion on banning the culling of male chicks. This might lead to an overestimation of animals used and/or killed for egg production. However, even though they might not be culled directly, they might be added to the flock of chicken used for meat production. Additionally, there is now ovo-sexing technology that allows for a chick’s sex to be identified before hatching and thus ensures that only female birds are born. However, for the sake of simplicity, and because this technology is not yet widely used across the world, we still assume the 1:1 ratio and culling of male chicks. If and when the technology becomes ubiquitous, we will update the formula used in the calculations.
Please be aware when combining different cuts from the same animal type results may be less accurate as each cut will be calculated as coming from a new animal. The number only reflects the amount of animals necessary to produce the specific amount of ingredients or number of meals from the specific cuts.
References
- Food and Agriculture Organization of the United Nations (2021): Livestock primary. FAOSTAT Database. Rome, Italy. Available at: http://www.fao.org/faostat/en/#data/QL [Accessed: 04.04.2021]
- Food and Agriculture Organization of the United Nations (2021): Food Balances (2014- ). FAOSTAT Database. Rome, Italy. Available at: http://www.fao.org/faostat/en/#data/FBS [Accessed: 03.08.2021]
- Food and Agriculture Organization of the United Nations (2021): Detailed trade matrix. FAOSTAT Database. Rome, Italy. Available at: http://www.fao.org/faostat/en/#data/TM [Accessed: 03.08.2021]
- Flachowsky, G., U. Meyer & K.-H. Südekum (2017): Land Use for Edible Protein of Animal Origin—A Review. Animals 7(12), 25. doi:10.3390/ani7030025
- Penn State Extension (2016): Understanding Beef Carcass Yields and Losses During Processing. Available at: https://extension.psu.edu/understanding-beef-carcass-yields-and-losses-during-processing [Accessed: 22.11.2021]
- Park, S.Y., D.S. Byeon, G.W. Kim, et al. (2021): Carcass and retail meat cuts quality properties of broiler chicken meat based on the slaughter age. Journal of animal science and technology vol. 63,1 (2021): 180-190. doi:10.5187/jast.2021.e2
- University of Wisconsin-Madison (n.d.): How much meat should a hog yield? Available at: https://livestock.extension.wisc.edu/articles/how-much-meat-should-a-hog-yield/ [Accessed: 22.11.2021]
- Flachowsky, G., U. Meyer & K.-H. Südekum (2017): Land Use for Edible Protein of Animal Origin—A Review. Animals 7(12), 25. doi:10.3390/ani7030025